Use the analytics page to track sales and profits
Updated May 31, 2026
See exactly what's selling, who's buying, and how your membership is growing
The Analytics page in your Fourthwall dashboard brings your shop and membership data together in one place. Use it to understand where your revenue comes from, spot your best-selling products, and track membership health over time.
Analytics tabs
The analytics dashboard is organized into three tabs: Overview, Shop, and Memberships. The Memberships tab appears only when memberships are active on your shop.
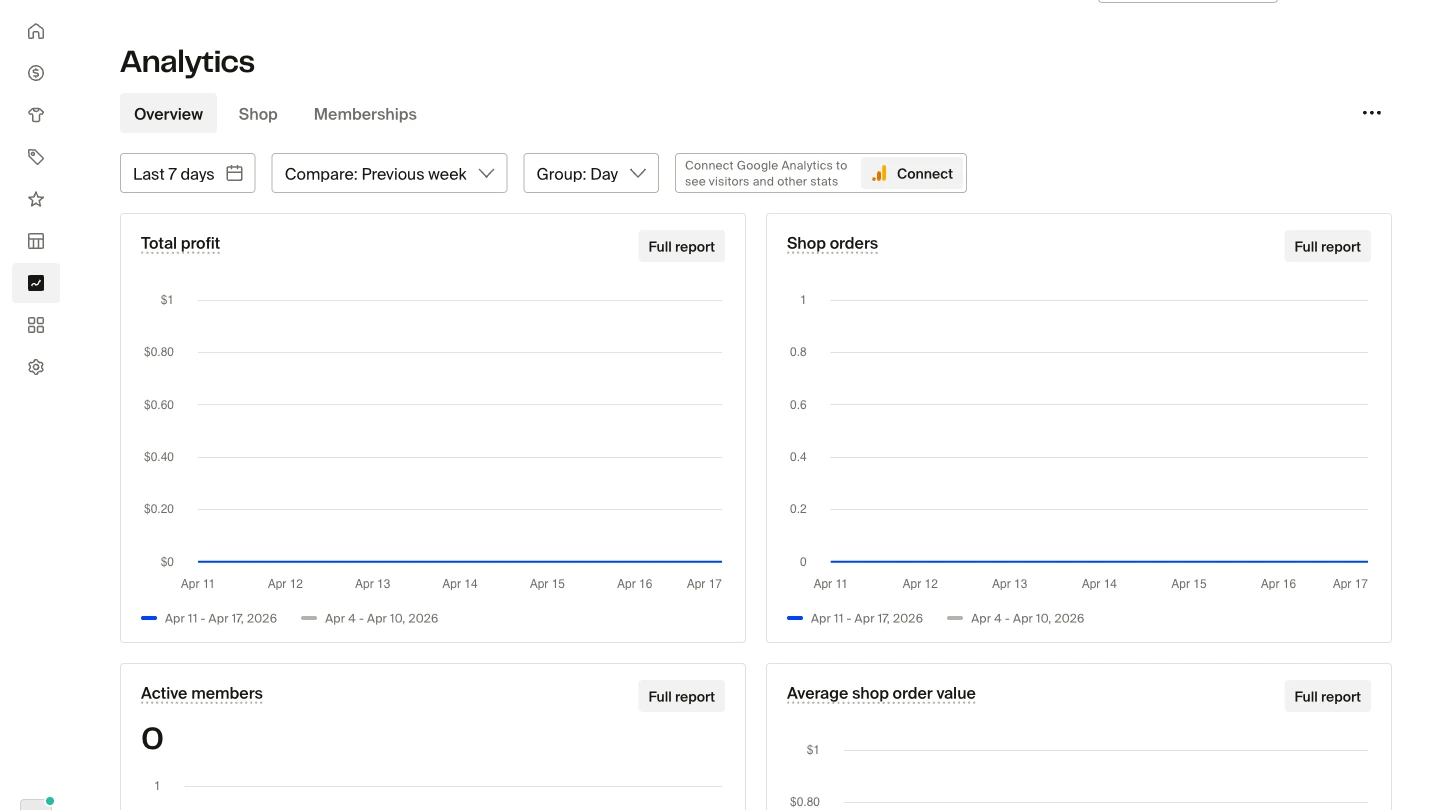
Use the tab bar to switch between views. Each tab focuses on a different part of your business.
Overview tab
The Overview tab shows a high-level summary of your key metrics across both shop and membership activity. Use it to get a quick snapshot before drilling into details on the other tabs.
Shop tab
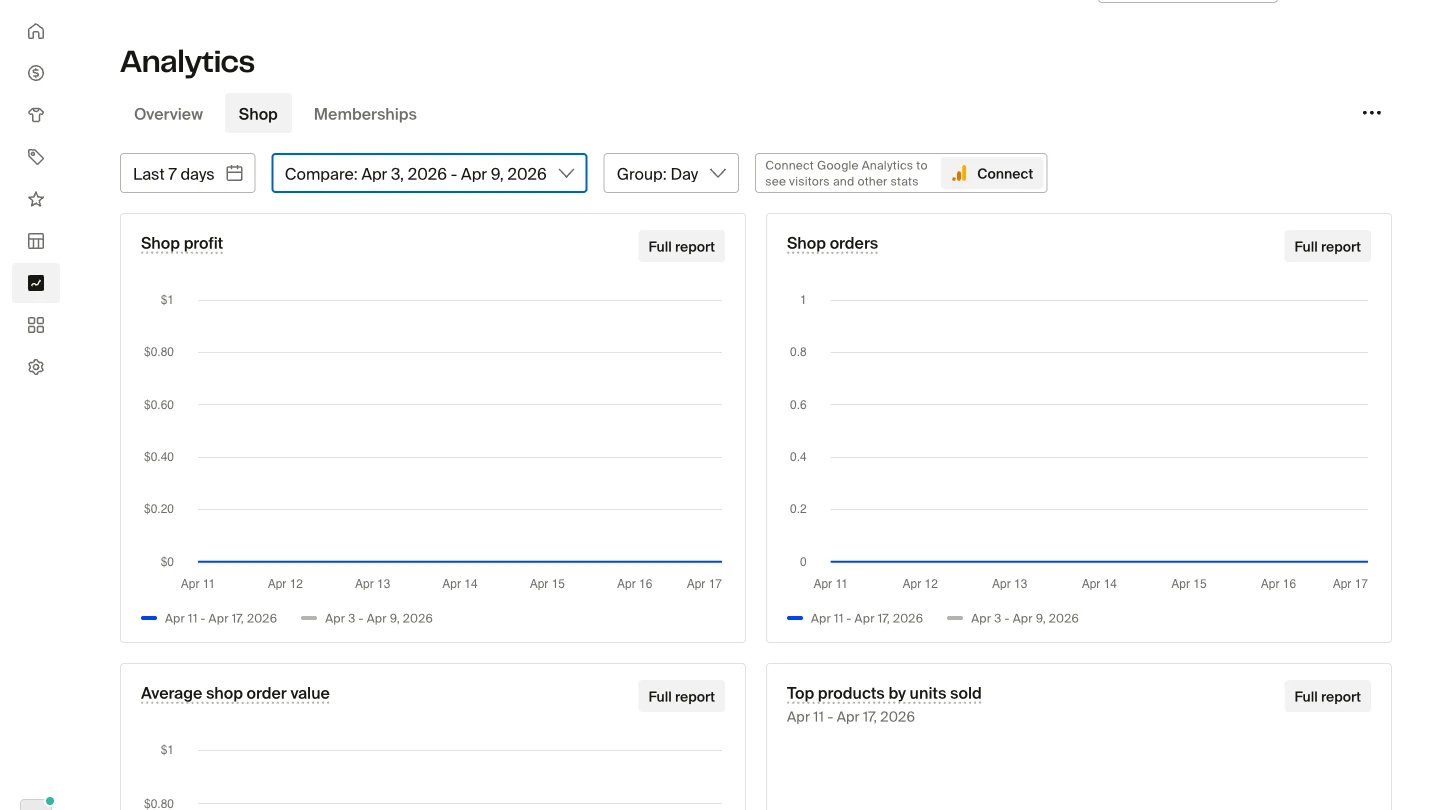
The Shop tab covers your ecommerce performance. Charts and report cards include:
- Total Profit — your profit over the selected date range, with a cost breakdown on hover (see Profit chart cost breakdown below)
- Average Order Value (AOV) — the average amount customers spend per order
- Orders — total order count
- Top Products by Units Sold — your best-performing products ranked by quantity sold
- Sales by Country — a geographic breakdown of where orders are coming from
- Payment Method Used — how customers paid at checkout (card, PayPal, Apple Pay, etc.)
- Sales by Source — revenue split by traffic source
- Sessions by Source — visit volume by referral channel
- Conversion Rate — percentage of sessions that result in a purchase
Memberships tab
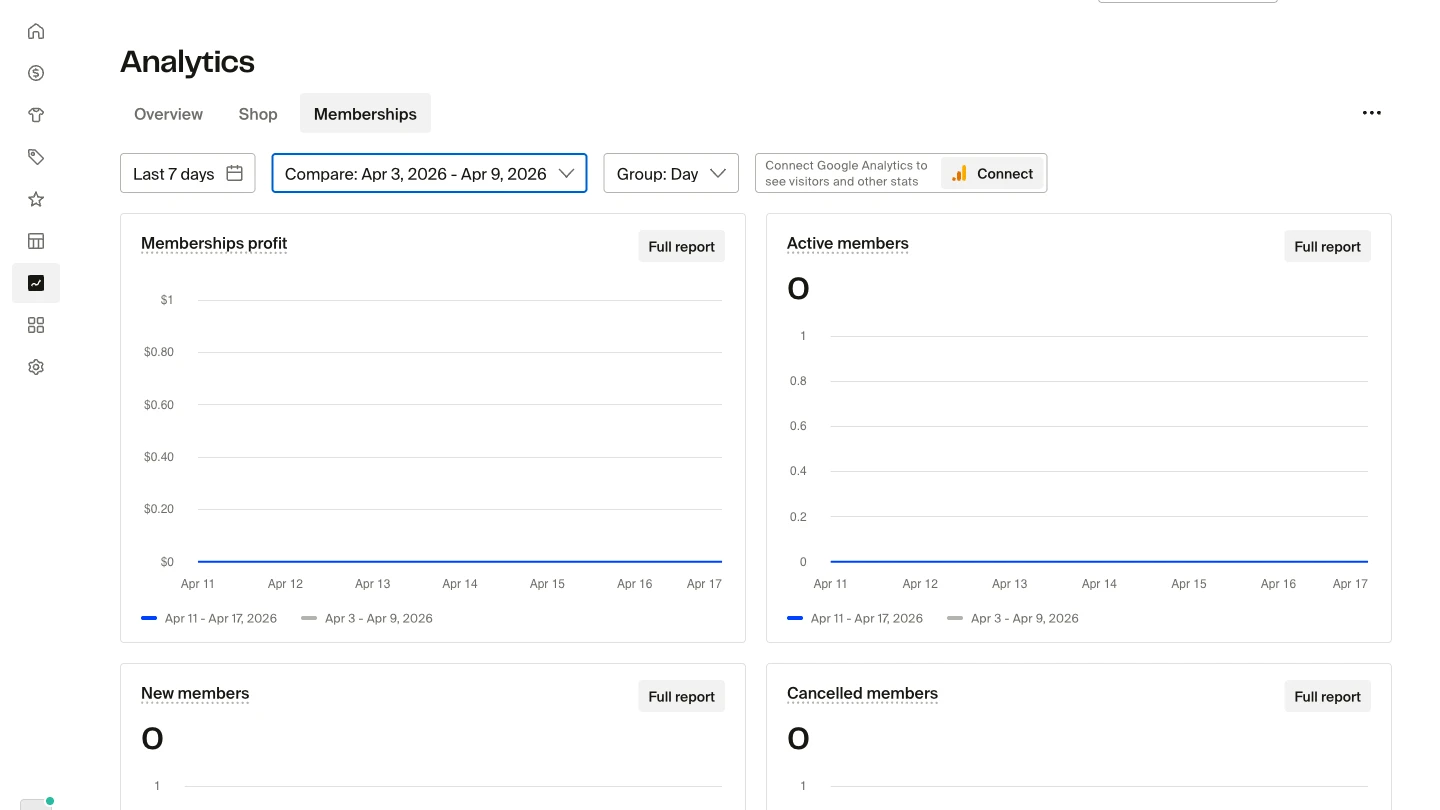
The Memberships tab gives you a dedicated view of your subscription business. Charts include:
- Active Members — total active members with a daily breakdown over the selected period
- New Members — members who joined in the selected date range
- Cancelled Members — members who cancelled in the selected period
- Free Accounts — members on a free tier
- Free Trials — active trial members
- Tier Activity — movement between membership tiers
- Top Tiers by New Members — which tiers are attracting the most new subscribers
- Most Played Content — your top-performing membership posts by play count (requires Mux video)
- Total Play Time — cumulative watch time across membership video content
- Number of Plays — total video play count
You can filter membership charts by tier using the tier filter at the top of the tab.
Reports tab
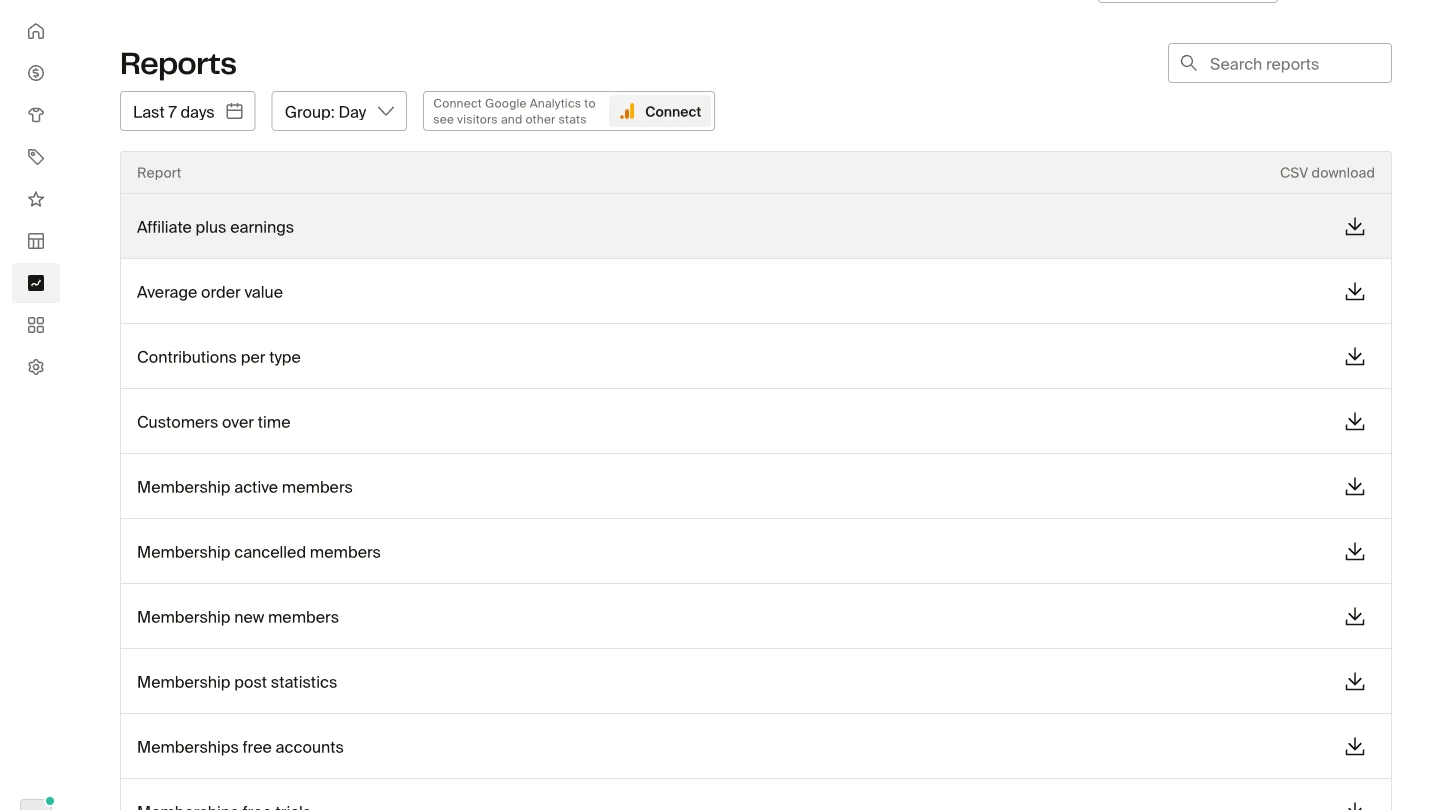
The Reports tab provides detailed data tables for downloading and analysis. Reports available include:
- Sales by UTM — revenue broken down by UTM parameters so you can see which campaigns and links are driving purchases
- Customers Over Time — tracks new and returning customer trends across the selected date range
- Additional sales splits by product, country, source, and date
To download a report as a CSV, open the report and click Export.
Profit chart cost breakdown
Hover over any point on the Profit chart to see a breakdown of the costs subtracted from Gross sales. The breakdown includes:
- Product costs — manufacturing and printing costs
- Fulfillment — shipping and handling
- Payment processing — transaction fees
- Membership fees — platform fees on membership revenue
This breakdown helps you understand your margin at a glance without running a separate report.
Filters
All tabs share the same filter toolbar at the top of the analytics page:
- Date range — choose from presets (today, yesterday, last 7 days, last 30 days, etc.) or set a custom range
- Compare — overlay a second date range to compare performance period over period
- Precision — switch between grouping data by day or by hour (available for shorter date ranges like today, yesterday, and last 7 days)
Some tabs also include additional filters, such as the tier filter on the Memberships tab and a gifting filter for separating gifting-related revenue.
Geography filter
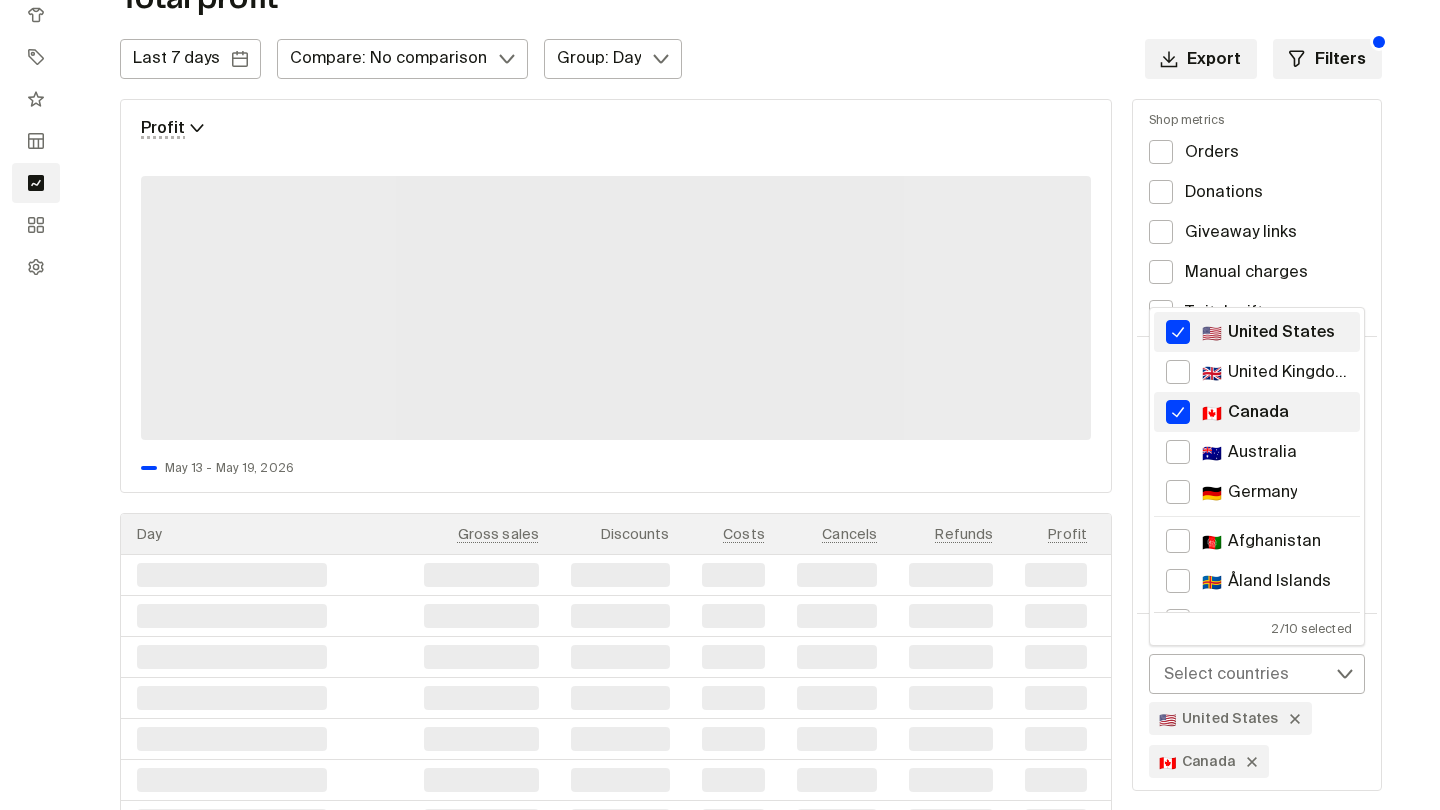
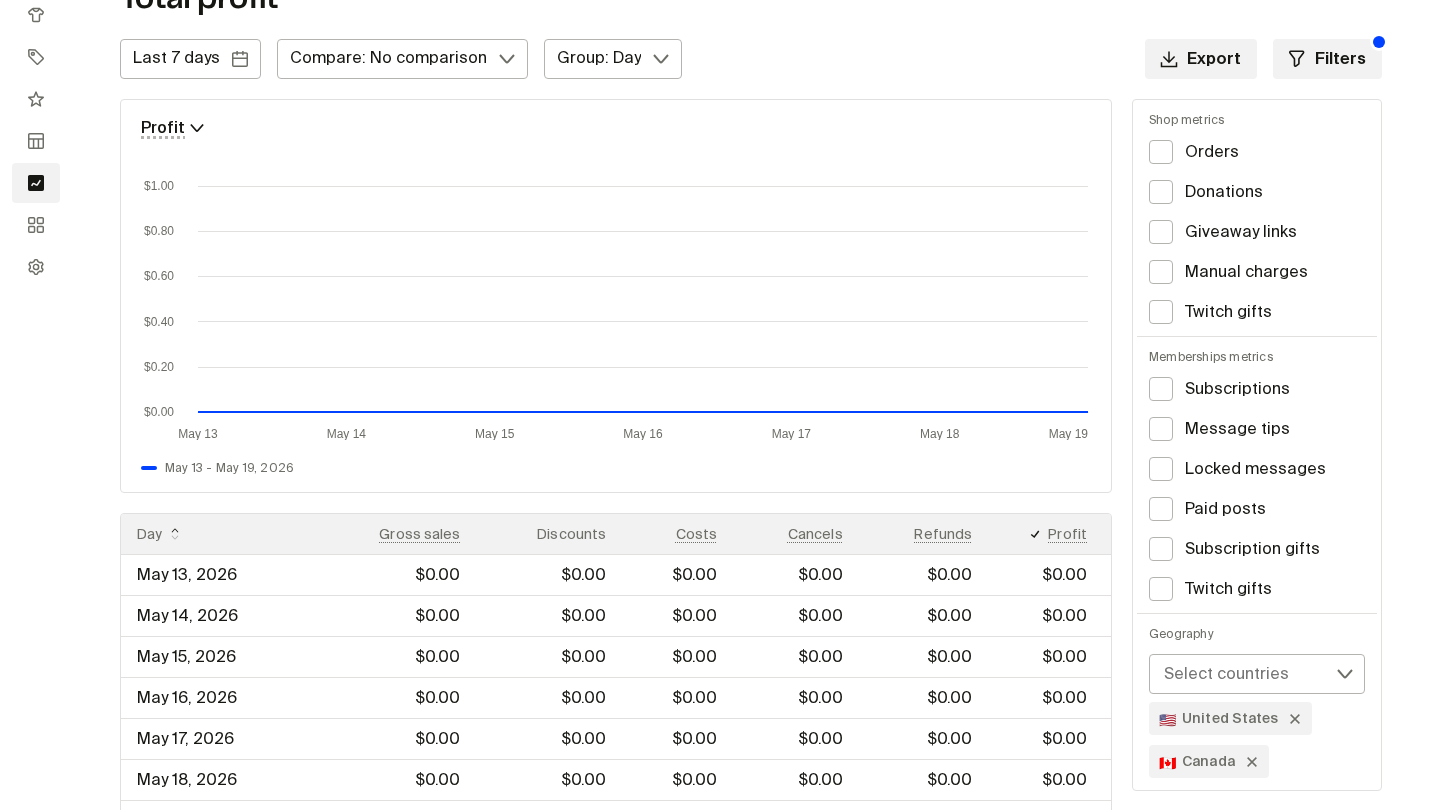
A Geography multi-select dropdown is available on five reports: Contributions per type, Customers over time, Sales over time, Top products by units sold, and Total profit. Open the report, click Select countries, then check one or more countries to scope the report to those markets. Selected countries appear as removable chips below the dropdown.
Country is determined from the order's billing address. If no billing address is present, the shipping address is used instead.
Frequently asked questions
Can I filter analytics by gifting activity?
Yes. A gifting filter is available to separate revenue and orders that came through gifting (Twitch gifting, giveaway links) from standard shop purchases.
How do I see which UTM links are driving sales?
Open the Reports tab and select Sales by UTM. You'll see revenue and order counts broken down by UTM source, medium, and campaign. Export to CSV for detailed analysis.
Does the Memberships tab show churn rate?
The Memberships tab shows cancelled members and active member trends, which you can use to calculate churn. A dedicated churn rate metric is visible in the active members daily breakdown.
Can I compare two time periods?
Yes. Use the Compare filter in the toolbar to add a second date range. Both periods appear on the same charts for side-by-side comparison.
Why don't I see the Memberships tab?
The Memberships tab only appears when memberships are active on your shop. If you don't see it, check that your membership is set up and published under Memberships in the dashboard.
Who counts as a "customer" in analytics?
A customer in Fourthwall analytics is someone who has placed an order or signed up as a paying member. Visitors who browse your shop without completing a purchase are not included in customer metrics. The Customers Over Time report in the Reports tab shows how your customer base is growing by tracking new and returning customers across the selected date range.
How do I track website traffic and site visits?
For traffic data, connect Google Analytics 4. See Adding Google Analytics to your site for setup instructions.
Can I see which products get the most page views?
Fourthwall's built-in analytics do not track page views for individual products. The Top Products by Units Sold report ranks products by quantity sold, not by how many times their pages were viewed. To see per-product page view data, connect Google Analytics 4 (GA4) to your shop and use the Pages and screens report in GA4 to see traffic for each product page. See Adding Google Analytics to your site for setup instructions.